Curve Selection and Color Table
![]() In physics, jerk is the rate of change of acceleration; more precisely, the derivative of acceleration with respect to time (third derivative) plots are displayed in the lower graph. If the element is a line, the velocity is constant and acceleration is 0.
In physics, jerk is the rate of change of acceleration; more precisely, the derivative of acceleration with respect to time (third derivative) plots are displayed in the lower graph. If the element is a line, the velocity is constant and acceleration is 0.
With the check boxes in the Curve selection table shown in figure below, you can select or clear each individual curve to be displayed.
When a curve is selected (see blue highlighted row in figure below), the Y-scale of the Curves graph is adjusted to display the Y-scale of the selected curve. Also, the color of the 'tick' line of the scale is changed to match the color code of the selected curve.
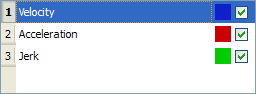
Figure 6-19: Curve Selection Table
How to change color
You can change the color of a plot as follows:
- Double-click on a colored square shown in the Curve Selection Table to open the color selection dialog box
- Click on an existing color square to select it, or specify the numerical values for a color. (You can also move the black indicator on the right side until the desired color appears in the large colored rectangle)
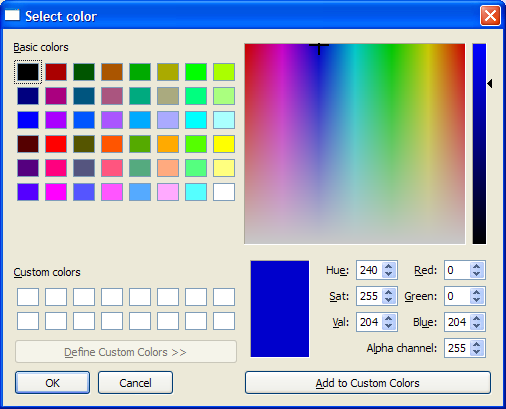
Figure 6-20: Standard Color Selection